[Learning] Kernel Debugging, Basic Driver Programming, and Basic BYOVD
Last Update:
Word Count:
Read Time:
Introduction
This article explains how to set up a Windows kernel debugging environment using WinDbg, how to develop a simple driver and basic BYOVD.
Recently, I have been studying MS12-020, a Windows vulnerability that requires an understanding of kernel debugging. Before working on this vulnerability, I had never performed kernel debugging before.
Therefore, I decided to write this article to document the process of setting up an experimental environment and developing a simple driver.

Kernel Debugging
Kernel debugging is an essential technique when studying kernel exploitation and kernel-level backdoors.
WinDbg is Microsoft’s official debugging tool and one of the most commonly used tools for Windows kernel debugging.
In this section, I will introduce several debugging methods and demonstrate how to perform kernel debugging on Windows XP, Windows 7, and Windows 10. These examples cover both legacy and modern Windows systems, as well as virtual machines and physical machines.
Named Pipe (COM)
This method is designed for debugging a virtual machine.
A named pipe is a named, one-way or duplex communication channel between a pipe server and one or more pipe clients. All instances of a named pipe share the same pipe name, but each instance has its own buffers and handles, providing a separate communication channel between the client and server.
Note: If you are interested in this technique, you can refer to the MSDN documentation.
Modern Windows systems (Windows 8 and later) should preferably not be debugged using this method. Instead, Microsoft recommends using KDNET.
The general procedure for debugging the Windows kernel through a named pipe is almost the same across different Windows versions, with a few differences.
First, we need to configure the Boot Configuration Data (BCD) to enable kernel debugging during the Windows boot process.
On Windows XP, we need to modify C:\boot.ini. However, this file is read-only by default.
Therefore, we need to change its permissions to make it writable:
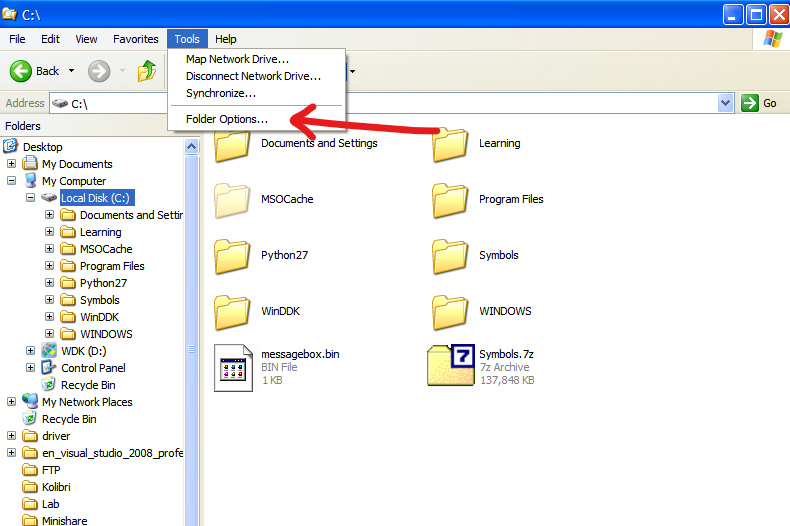
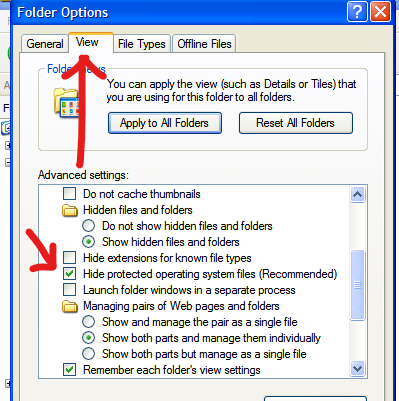
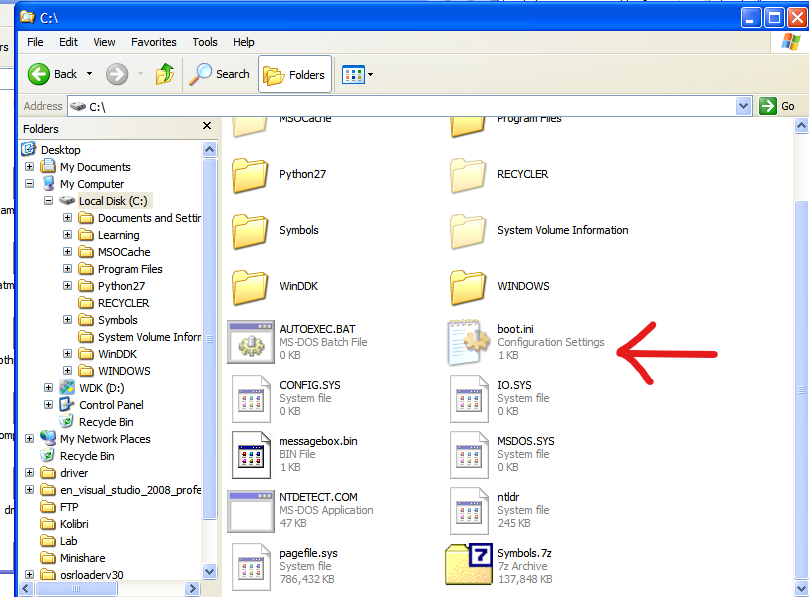
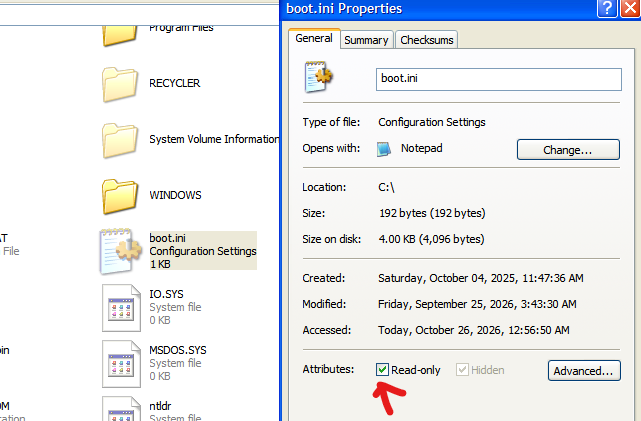
Then, append the following arguments to the [operating systems] entry and save the file:
1 | |
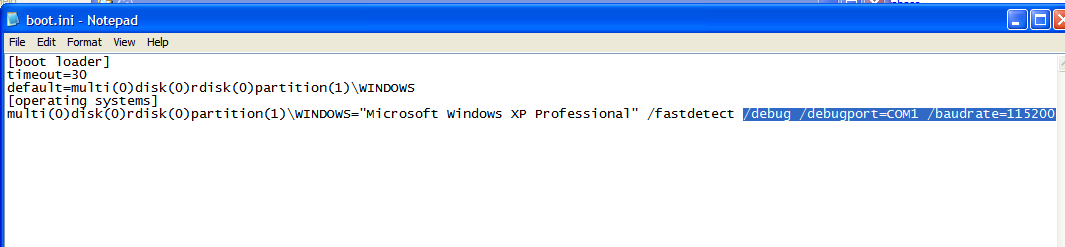
Next, shut down the virtual machine.
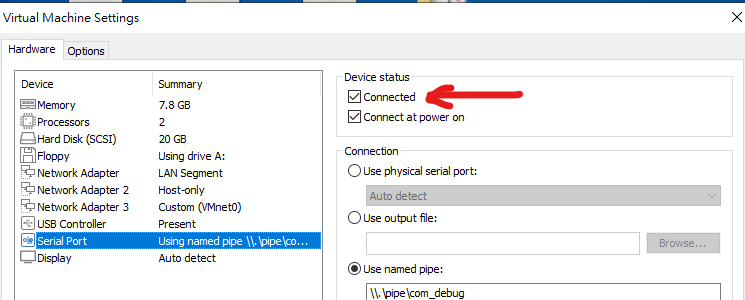
Open the Settings panel of your Windows XP virtual machine in VMware Workstation, add a new serial port, and configure it as follows:
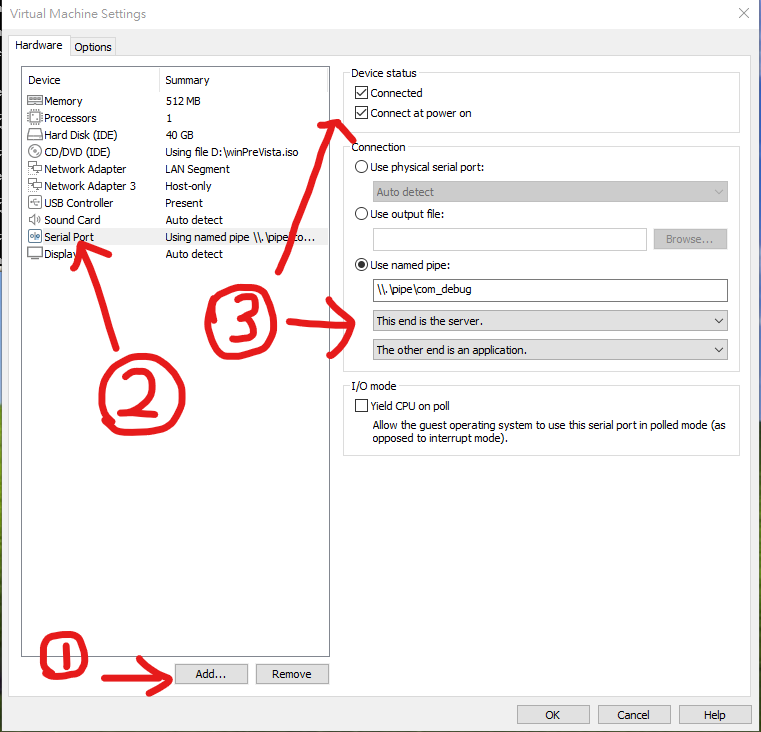
Here, I chose the named pipe option:
1 | |
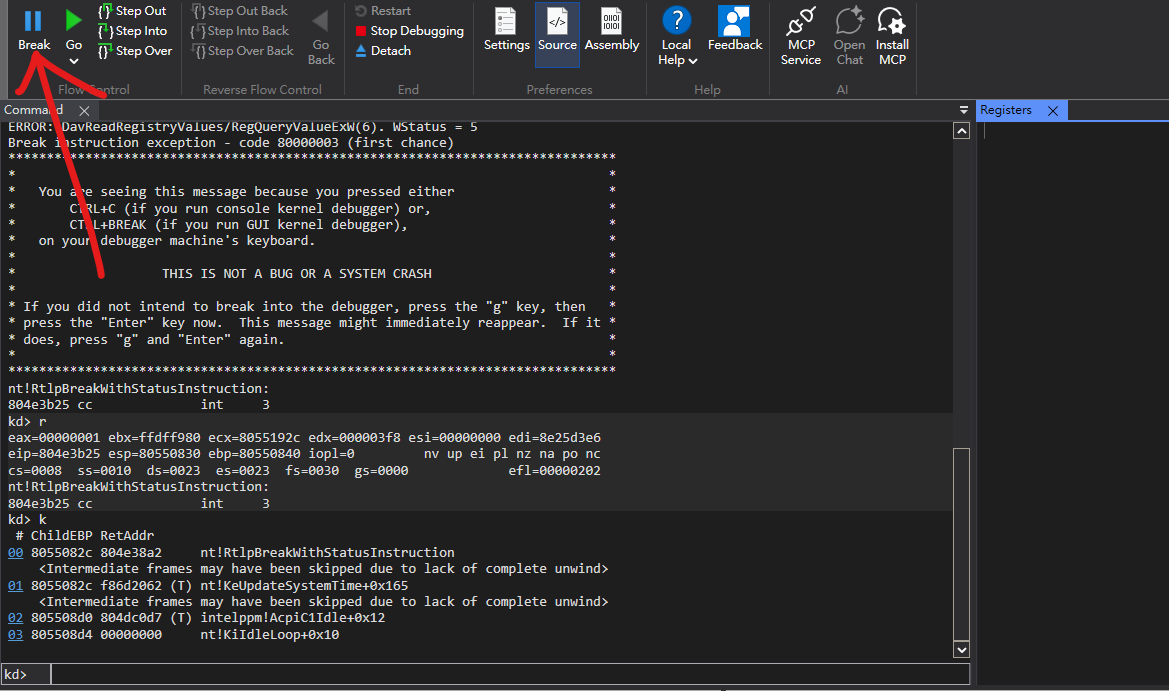
Finally, we can connect to the Windows XP kernel using WinDbg:
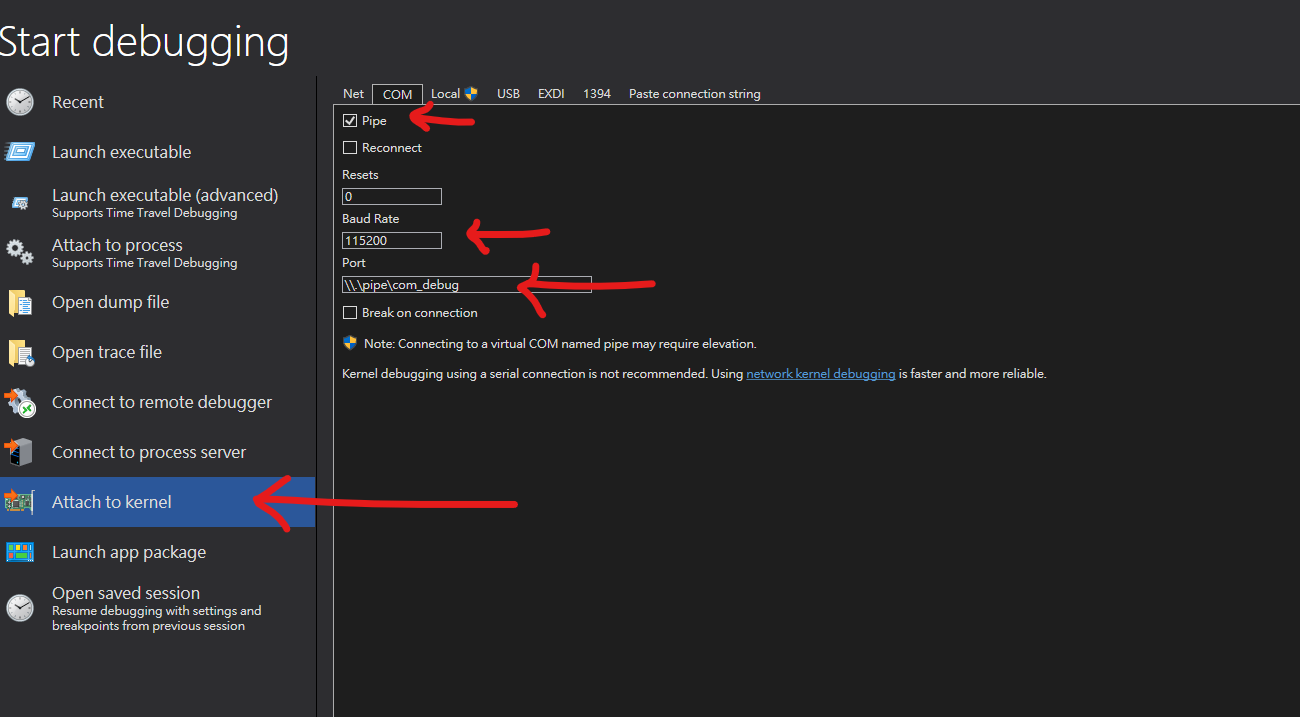
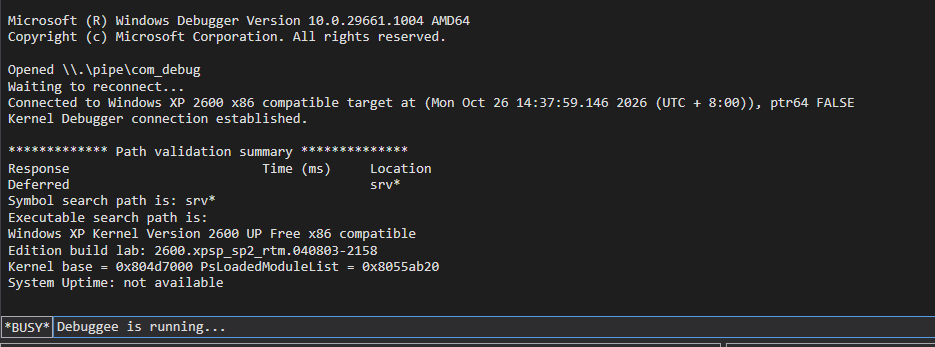
Starting with Windows Vista, Microsoft replaced C:\boot.ini with the Boot Configuration Data (BCD) store, which can be configured using bcdedit.exe.
Therefore, we can enable kernel debugging by running the following commands with administrative privileges:
1 | |
After configuring the target machine, the remaining steps for connecting to it with WinDbg are similar to those for Windows XP.
KDNET (Kernel Debugging over Network)
Kernel Debugging over Network (KDNET) is a network-based debugging solution designed for remote Windows kernel debugging.
Named pipe debugging is primarily used to debug virtual machines running on the same host. KDNET, however, allows us to debug not only virtual machines but also remote physical devices over a network. In addition, it generally provides faster communication than traditional serial debugging.
We can use the command below to check if KDNET is available:

We can configure KDNET by running the following commands with administrative privileges:
1 | |
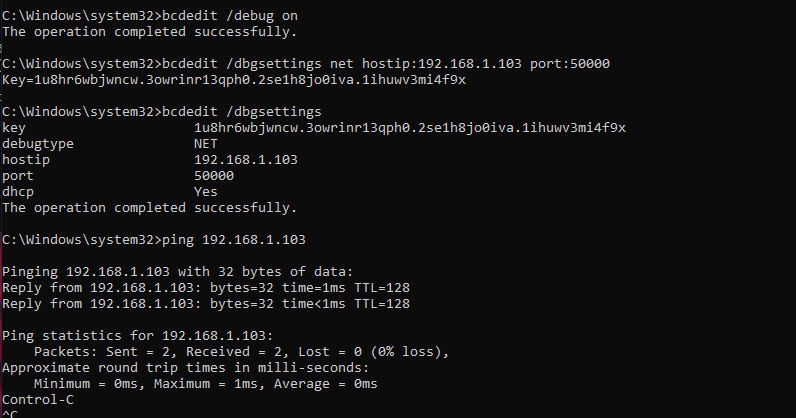
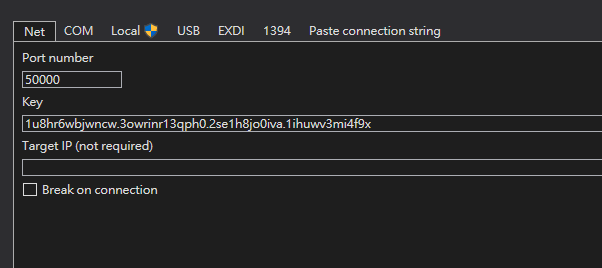

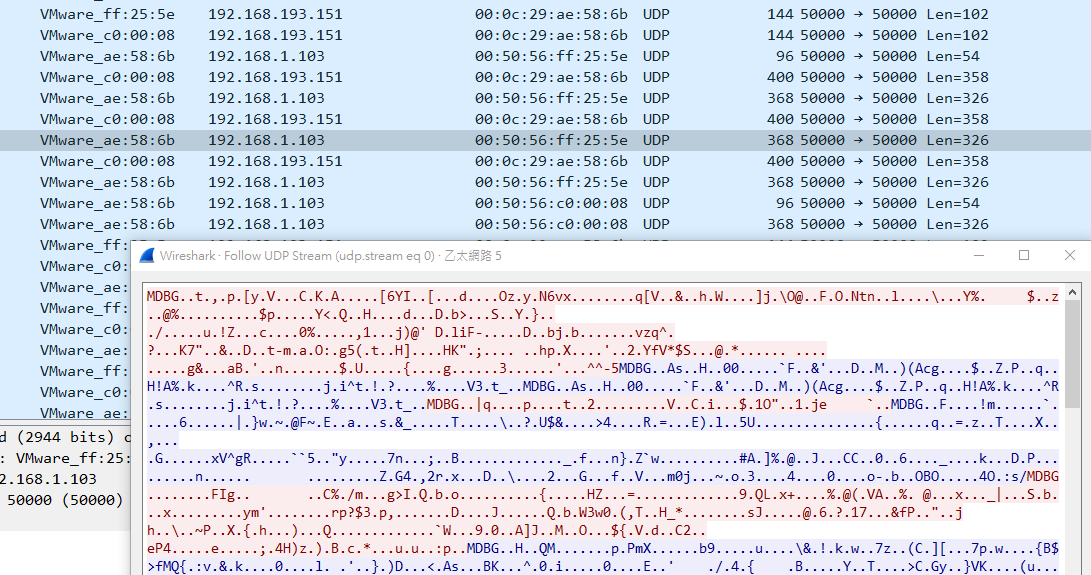
Here, I noticed something interesting. Although KDNET uses UDP as its transport protocol, the communication still appears to be reliable. Since I couldn’t find any detailed information about its implementation, I suspect that Microsoft may have implemented a custom mechanism to ensure reliable data transmission.
Paste Connection String
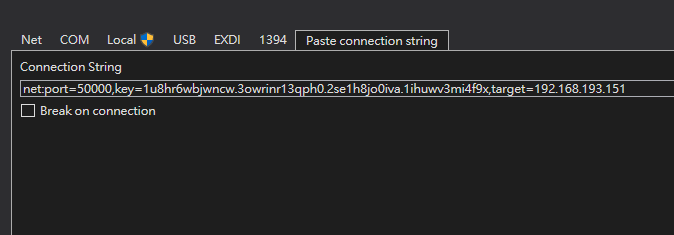
After configuring the target machine, WinDbg provides connection strings that we can use to connect to it.
For KDNET:
1 | |
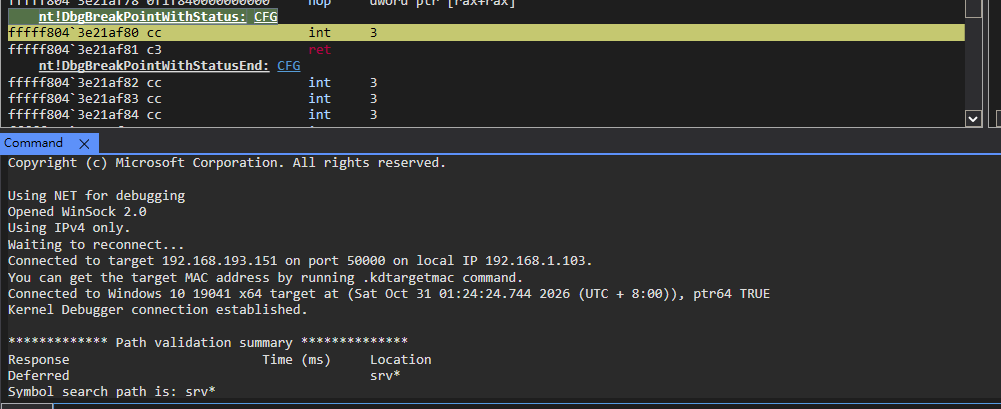
For named pipe debugging:
1 | |
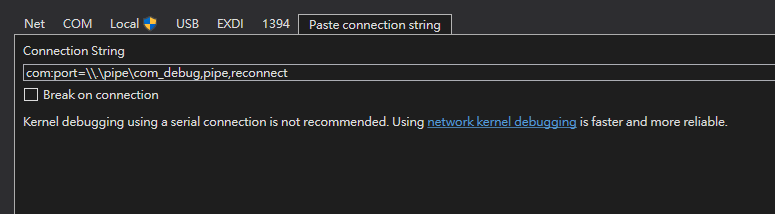
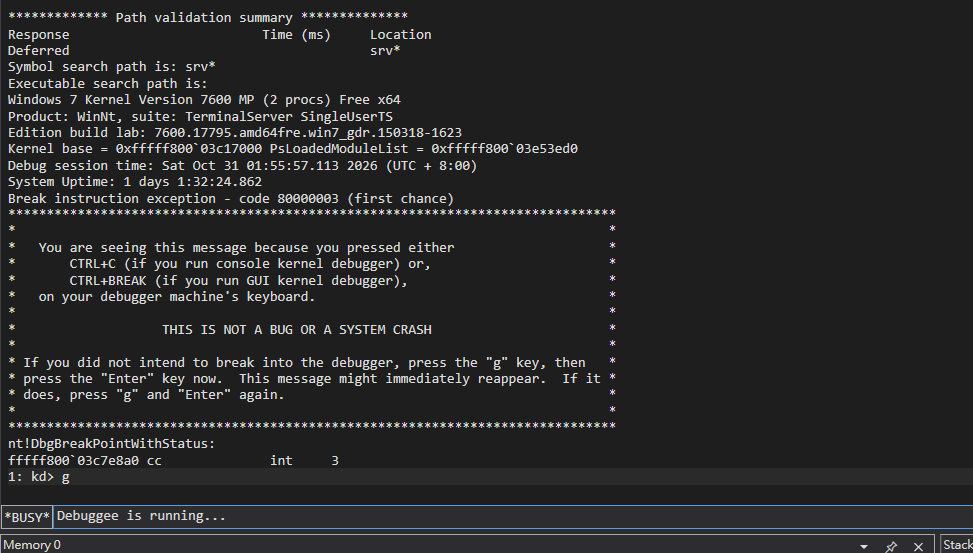
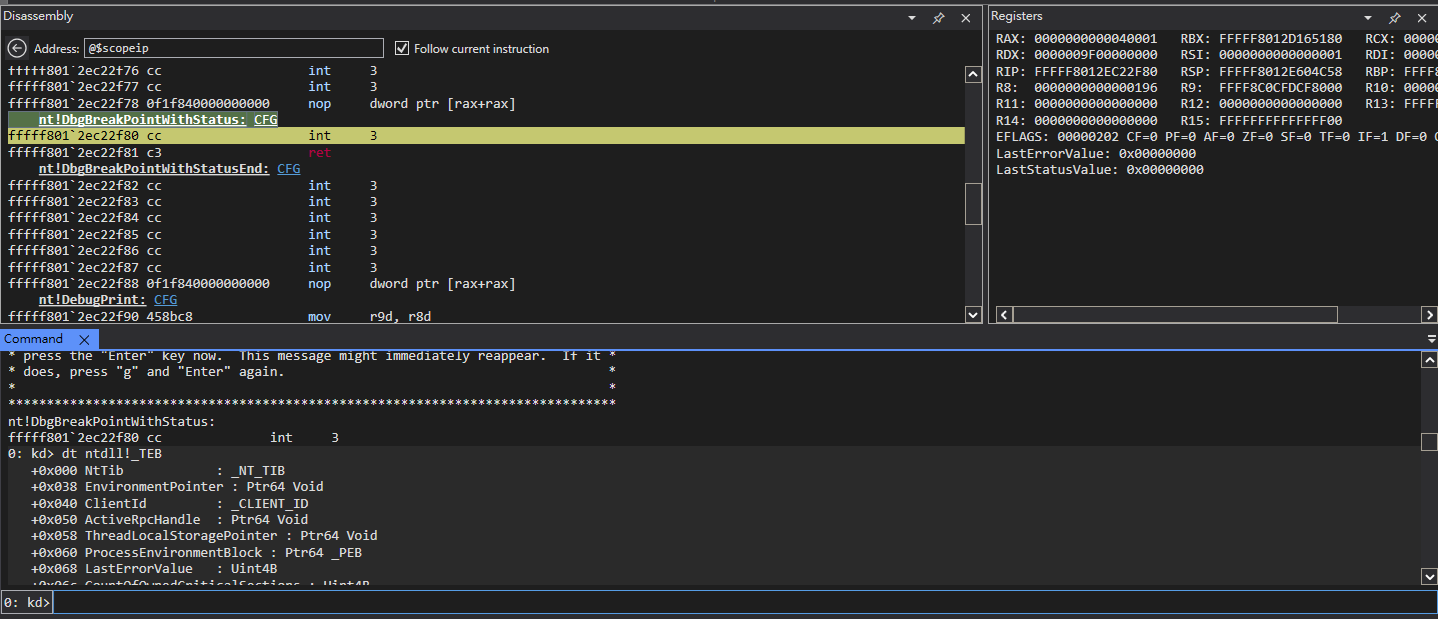
Local
This method is designed for debugging the local machine.
In practice, however, we rarely use it to debug the currently running Windows operating system in the same way that we debug a separate target machine.
Instead, local kernel debugging is useful for examining kernel data structures, memory, and Windows APIs.
Other Techniques
USB: This method is used for debugging physical machines. In certain scenarios, we may prefer to debug a physical Windows system, or the target machine may need to remain isolated from a network. In these cases, we need to connect directly to the target machine using a special USB debug cable.
If the target device supports USB 2.0 debugging, we need a compatible USB 2.0 debug cable with the required debugging circuitry. If the target device supports USB 3.0 debugging, we need a compatible Microsoft USB 3.0 debug cable. This cable uses two male USB Type-A connectors and does not provide a VBUS connection.
We CANNOT use an ordinary USB-A-to-USB-A cable for this purpose. Using an incompatible cable can damage the connected hardware.
EXDI: This technique can be used for kernel debugging and firmware debugging. It allows us to perform debugging at a lower level, potentially before the operating system has been loaded, such as when analyzing UEFI or BIOS firmware. In other words, this technique can help us investigate the system beyond the operating system itself. Depending on the hardware and debugging interface, it can also be useful when analyzing rootkits and bootkits.
1394: This is a legacy debugging method. Before USB 3.0 became widely available, FireWire (IEEE 1394) provided relatively high-speed communication, with transfer rates of 400 Mbps to 800 Mbps. It also supports Direct Memory Access (DMA), which allows connected devices to access system memory directly.
However, this capability also introduces security risks. An attacker with physical access to a system and a suitable DMA-capable device could potentially access memory without logging into the operating system.
Due to these security concerns and changes in hardware and Windows support, 1394 debugging is no longer a practical choice for modern Windows systems. For low-level debugging on modern platforms, we can consider alternatives such as Intel Direct Connect Interface (DCI) or virtual machines with EXDI support.
Due to hardware requirements and physical limitations, I will not cover these techniques in this article. However, I may introduce them in future articles if I get the opportunity!
Writing a Simple Custom Driver
Lastly, I want to introduce how to develop a simple custom driver and debug it. I believe this will help us take our first steps into the world of driver development and BYOVD (Bring Your Own Vulnerable Driver) attacks!
In this article, I will demonstrate how to develop a custom driver on Windows XP only. However, I plan to write another article covering driver development on modern Windows systems in the future.
Environment Setup
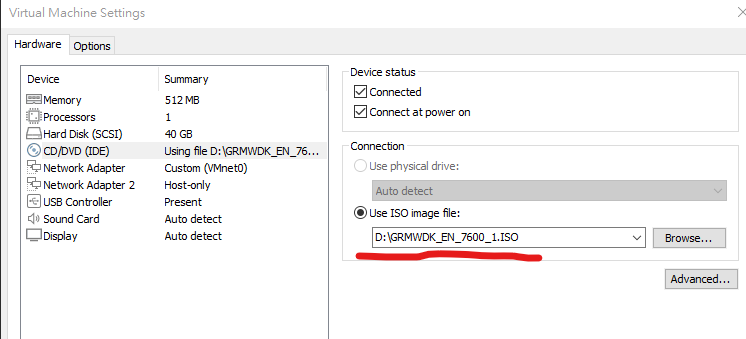
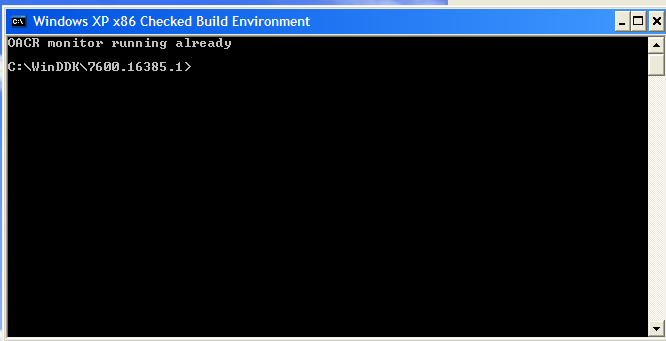
First, download the Windows Driver Kit (WDK) for Windows XP/7 (Windows Driver Kit Version 7.1.0). The downloaded file is an ISO image, so we need to mount it on our Windows XP virtual machine:
Then, install it just like VMware Tools:
Development
Create a new folder to serve as our workspace. Then, save the following code as helloworld.c:
1 | |
Next, we also need a makefile (without a file extension):
1 | |
Finally, save the following content in a file named sources (also without a file extension):
1 | |
These are the essential files required to build our driver.
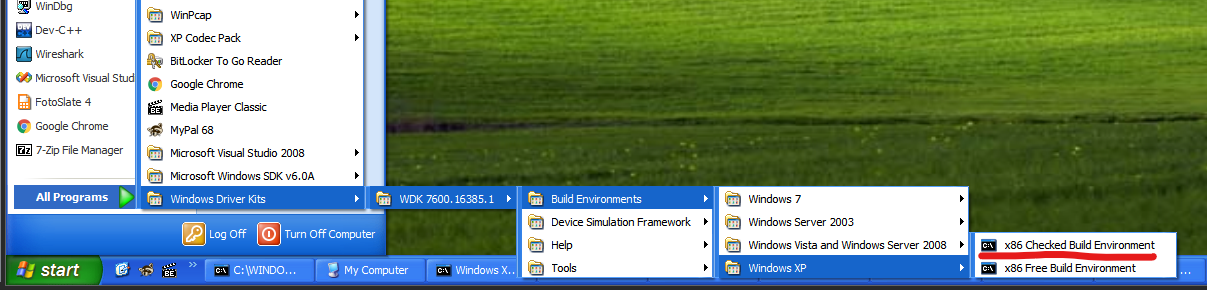
Once everything is ready, open the WDK Build Environment and run:
1 | |
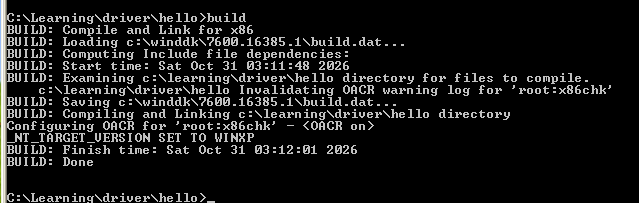
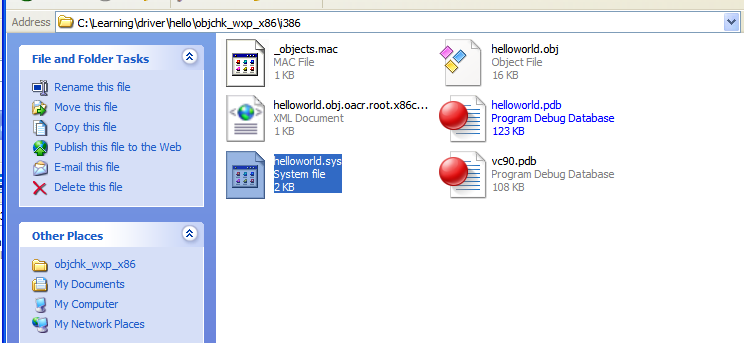
After the compilation process finishes, the driver file helloworld.sys should be generated.
Loading the Driver
To load our driver into the operating system, we can use the following commands:
1 | |
Alternatively, we can use other tools designed for driver development:
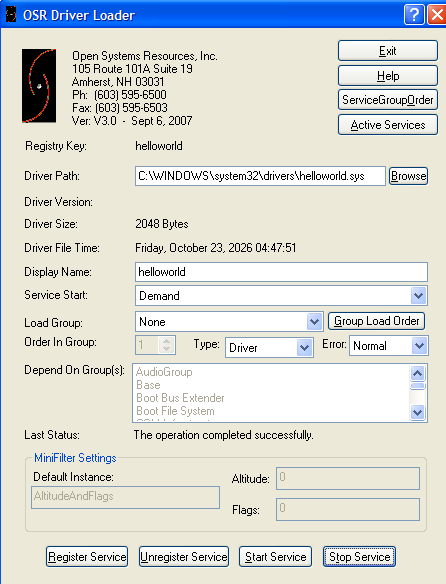
After compiling, we should have the helloworld.sys file.
Move it to the following directory:
1 | |
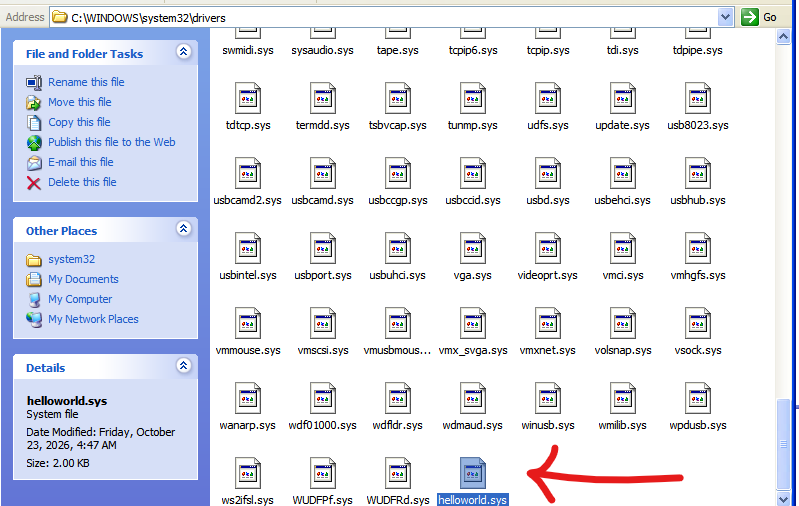
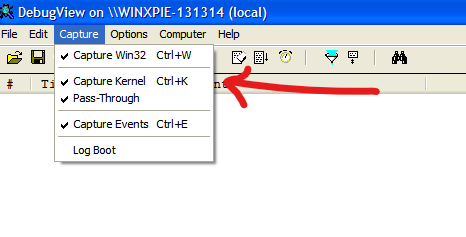
Next, open DebugView (included in the Sysinternals Suite) and enable Capture Kernel.
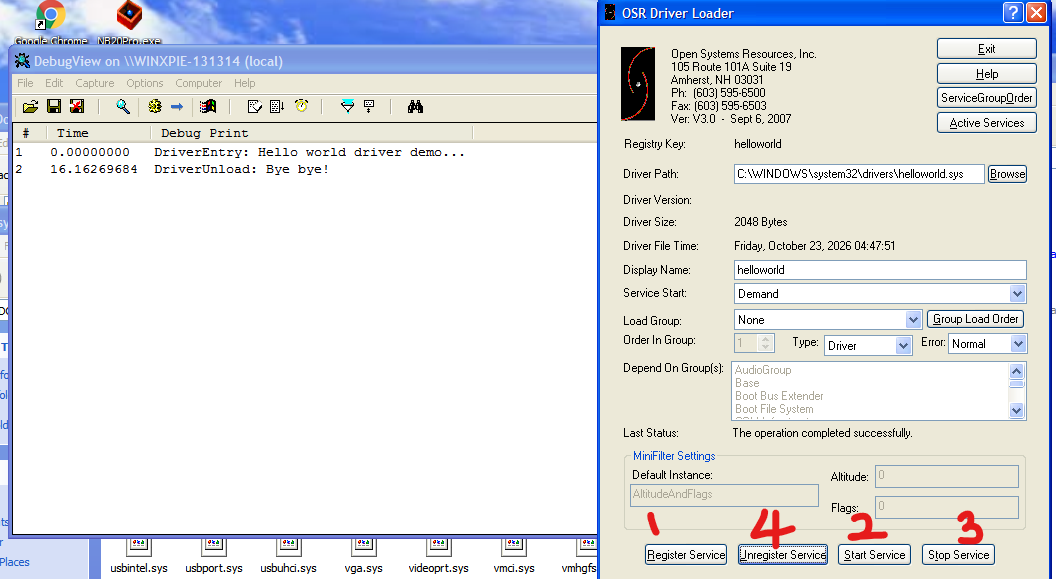
Then, register our custom driver and start the service. We should be able to see the debug messages generated by our driver, confirming that it has been successfully loaded.
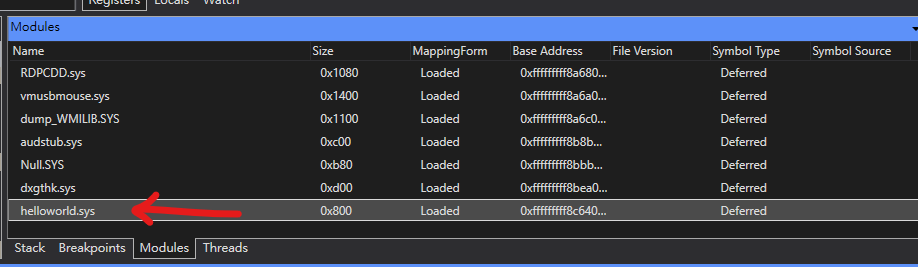
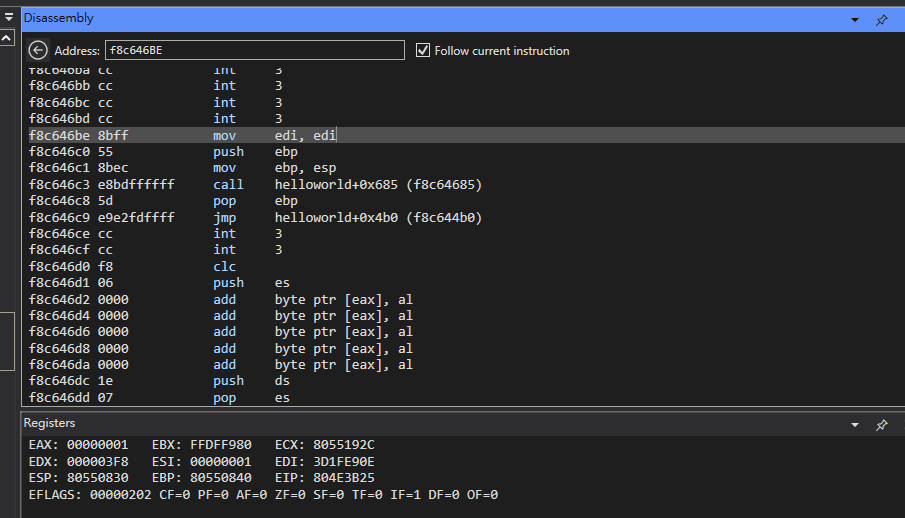
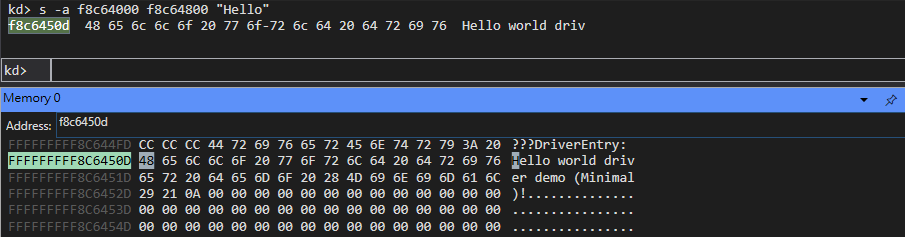
We can also demonstrate this using WinDbg:

Crashing
One of the biggest headaches when developing drivers is dealing with exceptions.
When developing a user-mode application, an exception does not necessarily cause the entire application to terminate. Depending on how the exception is handled, the application may be able to continue running.
For example, if we find a buffer overflow vulnerability, we may be able to trigger an exception and crash the application, just like what I demonstrated in From Bug To Exploit.
However, things are quite different in kernel mode. If a driver causes an unhandled exception or encounters a fatal error, the operating system may trigger a Blue Screen of Death (BSoD).
The following code demonstrates how to intentionally trigger a BSoD using KeBugCheckEx(). Alternatively, we can trigger a kernel-mode exception that may eventually lead to a system crash.
1 | |
Basic BYOVD
Lastly, I want to introduce the basic concepts behind BYOVD.
In short, BYOVD (Bring Your Own Vulnerable Driver) is a technique commonly used for privilege escalation and security evasion. An attacker takes advantage of a vulnerable driver that can be loaded into the operating system. Since drivers run in Kernel Mode, exploiting an unsafe driver interface may allow an attacker to perform privileged operations that would otherwise be restricted in User Mode.
1 | |
As shown above, this driver creates a symbolic link named \\DosDevices\\ExploitMe. This allows a User Mode application to open the device using the CreateFile API and communicate with the driver through DeviceIoControl, passing an IOCTL code along with input and output buffers.
We can implement a simple proof of concept as follows:
1 | |
When our application calls DeviceIoControl from Ring 3, the following steps take place:
- The I/O manager receives the request and packages it into an I/O Request Packet (IRP).
- The I/O manager dispatches the IRP to the appropriate driver by calling its corresponding dispatch routine, in this case,
DrvDispatch. - After the driver finishes processing the request, it completes the IRP by calling
IoCompleteRequest, allowing the I/O manager to return the result to the application.
Instead of simply reading or writing a stream of bytes, an application can request a specific operation by passing a control code to DeviceIoControl. This control code is known as an IOCTL (I/O Control) code.
In Windows, an IOCTL code is a 32-bit value generated using the CTL_CODE macro:
1 | |
The macro takes four parameters:
- Device Type (
FILE_DEVICE_EXPLOIT_ME): Defines the device type. Vendor-defined device types generally use values from0x8000to0xFFFF. - Function Code (
0x800): Identifies the operation to be performed by the driver. Vendor-defined function codes generally use values from0x800to0xFFF. You can think of it as a route in a web API. - Transfer Method (
METHOD_NEITHER): Determines how the I/O manager handles the input and output buffers. WithMETHOD_NEITHER, the I/O manager passes the original user-mode virtual addresses to the driver without copying or validating the buffers. The driver is responsible for safely accessing these addresses. As we will see later, mishandling these pointers can introduce serious security vulnerabilities. - Required Access (
FILE_WRITE_ACCESS): Specifies the access required on the device handle for the I/O manager to allow this IOCTL request.
In User Mode (Ring 3), the application calls DeviceIoControl and provides the IOCTL code, along with the input and output buffers:
1 | |
In Kernel Mode (Ring 0), the driver’s dispatch routine retrieves the IOCTL code from the IRP stack and processes the request using a switch statement:
1 | |
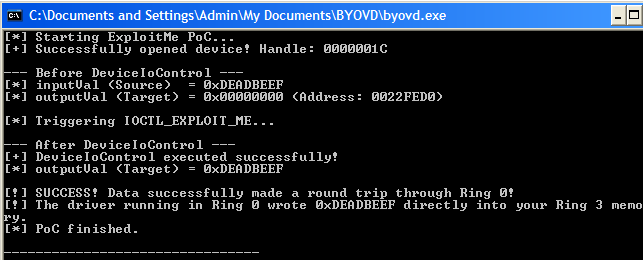
Now, let’s run the PoC program!
Conclusion
In this article, I introduced several methods of Windows kernel debugging. I then demonstrated how to develop a simple driver and eventually explored the basic concepts of BYOVD.
Driver development is actually much more complicated than I expected. In addition, BYOVD is an advanced technique used in modern red teaming. The content covered in this article is far from sufficient to fully understand these techniques, and the simple BYOVD example demonstrated above is nowhere near enough for real-world applications.
However, I will keep learning and exploring this field, and hopefully introduce more advanced topics in future articles!
Lastly, I feel like I have finally taken my first steps into the world of kernel and driver development. From webshells and bootkits to buffer overflows, kernel exploitation, and driver programming… It still feels unreal.
If you have any comments or suggestions, please feel free to leave them below!
THANKS FOR READING!
Well, it’s been a tough few days recently… no new drawing T.T
But! I am working on a new one! Hopefully, I will share it in the next article!